Connected things 2015
Trippy
A connected car better serving your needs
With Automile Little Printer
If we had more detailed information about our consumption of goods and services, would we make better decisions?
This is a question I’m exploring across a series of projects. Trippy is one of them. Cars, as commonly used, aren’t very resource-efficient — most of the time they sit in a garage or parking lot, and you pour money over them to keep them running. On the other hand, the freedom is hard to beat. By looking at your own car as a service, can you learn something? Can you compare it more easily to other modes of transport?
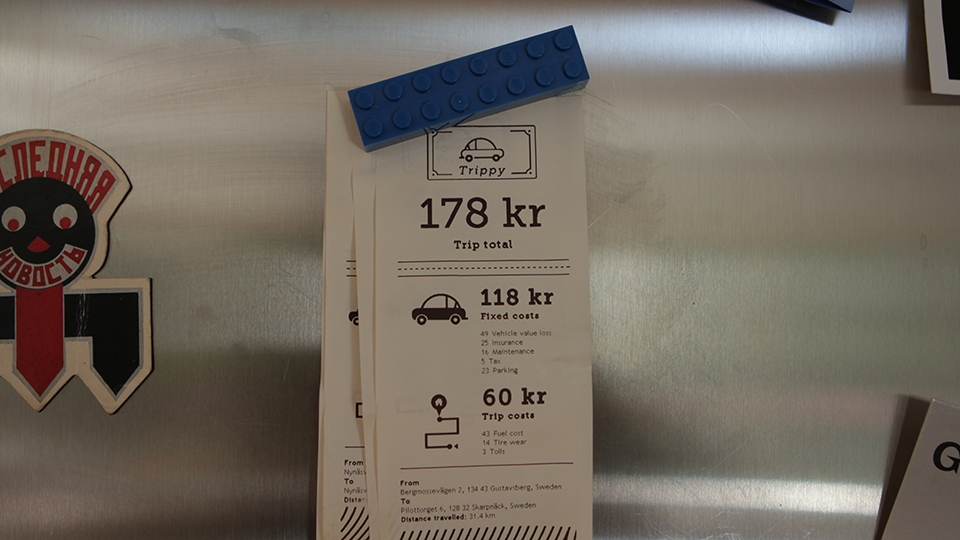
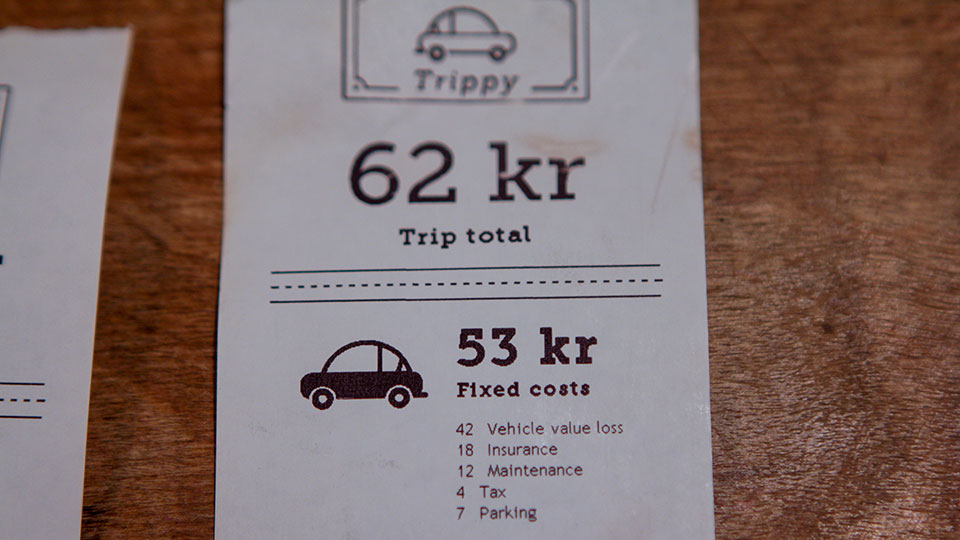
Trippy logs every trip and calculates the actual cost: fuel, depreciation across the journey, insurance, tyre wear. It prints to a taxi-style receipt on my Little Printer — a tangible artefact for each journey. The trip data comes from the clever device and service from Automile, tracking position, distance, and fuel use.
Brought to prototype to see whether it would actually be useful. It’s no longer working — Little Printer’s demise. Bless its little electronic soul.
Next in the series is a yet-unnamed service that helps you understand your grocery shopping behaviour better.
Icons from The Noun Project (route by Juan Pablo Bravo, car by Murali Krishna). Thanks to Pelle Lindhe for coding help.